By Robert Murphy, Senior Managing Director
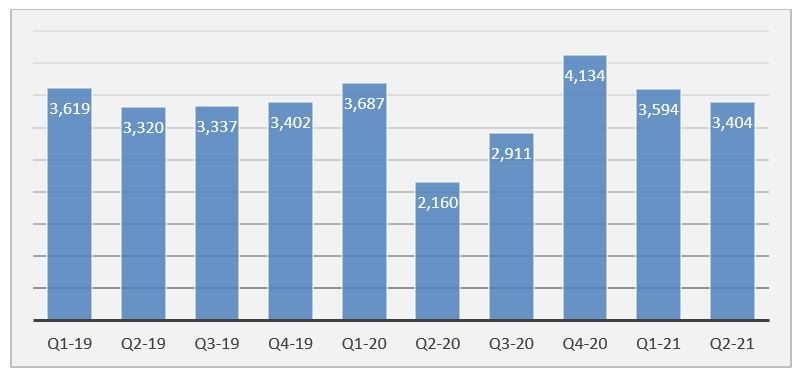
North American M&A deal activity remained strong in Q2 of 2021, following a strong first quarter in 2021 and a record breaking fourth quarter in 2020. YoY deal volume was 57.6% higher than the volume in Q2 2020. Through the first half of 2021, deal volume is on pace to approximate record highs.
Closed M&A Deals in North America (Q1 2019 – Q2 2021)
 Source: Pitchbook and PKF Investment Banking research.
Investor confidence remains high as the equity markets continued to record broad gains. Other factors, such as levels of uncommitted capital, potential increase in capital gain tax rates, low interest rates, reduced uncertainty for buyers and sellers, and increased CEO confidence all contributed to the already heated M&A market. With over $1.5 trillion dry powder in the U.S. equity firms, the US PE deal making notched a record-setting pace through Q2 2021. PE exit activity through H1 2021 is also on track for a record-setting year.
Transaction Multiples Increased
Average transaction multiples in Q2 2021 with Transaction Enterprise Values (TEV) of $10 million to $250 million has rebounded to 7.2x after three quarters in which pricing averaged 6.6x-6.9x. It again signals a strong recovery of the M&A market and transaction valuations, especially for those companies that have performed well through COVID.
| Q1 2020 | Q2 2020 | Q3 2020 | Q4 2020 | Q1 2021 | Q2 2021 |
# of deals | 95 | 36 | 59 | 131 | 95 | 81 |
TEV/EBITDA | 7.3x | 7.3x | 6.6x | 6.9x | 6.9x | 7.2x |
Total Debt/EBITDA | 3.9x | 3.3x | 3.7x | 3.7x | 3.9x | 3.7x |
| Senior Debt/EBITDA | 3.5x | 2.7x | 2.7x | 3.1x | 3.6x | 2.9x |
Source: GF Data®
Higher performers with above-average TTM EBITDA margins and sales growth continued to be rewarded with premium valuation multiples. In Q2 2021, the buyout targets with above average financial performance were valued at an average of 7.8x, increasing from an average of 7.6x in Q1 2021. This “quality premium” phenomenon has been observed since the second half of 2020, when the reward in valuation for better performance represented over 30% premium, compared to a historic average of 14%. The rest of the buyout targets in Q2 were valued at an average of 5.8x, compared to 5.7x in Q1 2021, indicating a bigger valuation multiple gap between the targets that have strong TTM performance with clear industry sector visibility and companies with weak TTM performance and cloudy visibility.
Quality Premium – Buyouts Only
| 2003-2016 | 2017 | 2018 | 2019 | 2020 | YTD | Total |
Above Average Financials | 6.4 | 7.8 | 7.8 | 7.6 | 7.8 | 7.8 | 6.9 |
Other Buyouts | 5.9 | 6.4 | 6.3 | 6.3 | 6.1 | 5.8 | 6.0 |
Premium (/Discount) | 109% | 122% | 123% | 120% | 128% | 133% | 115% |
Incidence | 56% | 56% | 59% | 52% | 55% | 62% | 56% |
Source: GF Data®
Debt Leverage Stabilized at Pre-COVID Levels in Q2 2021
Debt levels have been steadily returning to pre-COVID levels since Q3 2020. Total debt utilization is largely unchanged in Q2 2021. Low interest rates across investment-grade and high-yield debt have boosted debt utilization to support M&A transactions.
The average debt leverage in Q2 2021 of 3.7x EBITDA comprised 2.9x senior debt and .8x subordinated debt, compared with 3.6x and .3x in Q1 2021, respectively. The decreased portion in senior debt implies a slowdown in add-ons as most of the add-ons tend to structure the debt with all senior debt. GF Data noted that add-ons account for 23% of the sample transactions in 2021, a drop from an unprecedented high of 30% in 2020.
Total Debt/EBITDA – All Industries by Deal Size
TEV | 2003-2016 | 2017 | 2018 | 2019 | 2020 | YTD | Total | N = |
10-25 | 3.2 | 4.0 | 3.4 | 3.8 | 3.6 | 3.9 | 3.4 | 1,307 |
25-50 | 3.5 | 3.9 | 3.6 | 3.9 | 3.4 | 3.6 | 3.5 | 1,063 |
50-100 | 3.7 | 4.3 | 4.1 | 3.9 | 3.6 | 3.7 | 3.8 | 736 |
100-250 | 4.3 | 4.7 | 4.8 | 4.4 | 4.7 | 4.2 | 4.4 | 396 |
Total | 3.5 | 4.1 | 3.8 | 3.9 | 3.7 | 3.8 | 3.6 |
|
N = | 2,291 | 235 | 266 | 284 | 270 | 156 |
| 3,502 |
Note: Deals with no debt are eliminated from leverage data, as are significant outliers. Please note that N for 2003-16 encompasses 14 years of activity. Source: GF Data®
Outlook for Remainder of 2021
The outlook for LMM M&A remains very positive for the second half of 2021. As business reopened and economy recovered, business leaders and investors are more confident and open to develop M&A strategies to accelerate growth and gain scale. The abundance of capital and low interest rates encourage the spending of corporates and financial investors. As a result, highly sought-after deals for innovations and targets with outstanding performance are likely to continue to command a premium under this competitive market.
Anticipating an increase in capital gains tax in 2022, many sellers are racing to close deals in 2021. However, many other companies are waiting to launch an M&A process until Q3 2021 to ensure the disruptions of Q2 2020 are not included in the last 12 months financial metrics, in order to present more normalized performance.
Government spending and increasing consumer expenditure will continue to create optimal environment for business recovery across sectors. We expects a dynamic M&A situation to be continued throughout the second half of 2022.
Contact Us
Robert Murphy
Senior Managing Director
rmurphy@pkfod.com
561.337.5324 | 201.788.6844