M&A Deal Activity Surged in Second Half of 2020
By Robert Murphy, Senior Managing Director
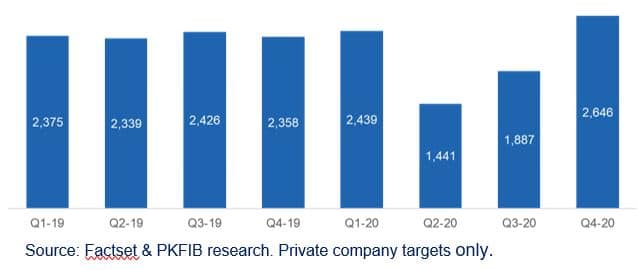
After a precipitous decline in Q2 2020, mergers and acquisitions transactions in North America rose 84% from Q2 to Q4 2020 after experiencing a 38% decline in Q2 and a 22% decline in Q3. The sharp recovery saw the total number of deals in 2020 reach 8,413, only an 11.4% decline from 2019.
Q4 2020 closed as one of the strongest quarters for M&A over the past decade.
Closed M&A Deals in North America (2019-2020)

Lower middle market M&A activity in Q4 2020 mirrored the pattern of the broader market, showing strong resilience in spite of the challenging economic environment. Activity was particularly robust in several sectors:
- Technology – came out ahead and was the only sector to gain in transaction value over 2019.
- Healthcare – transactions involving both inpatient and outpatient care facilities increased sharply in Q4.
- Financial Services – M&A activity also accelerated in financial services, insurance and related industries.
Transaction Multiples Remained Strong in the Lower Middle Market
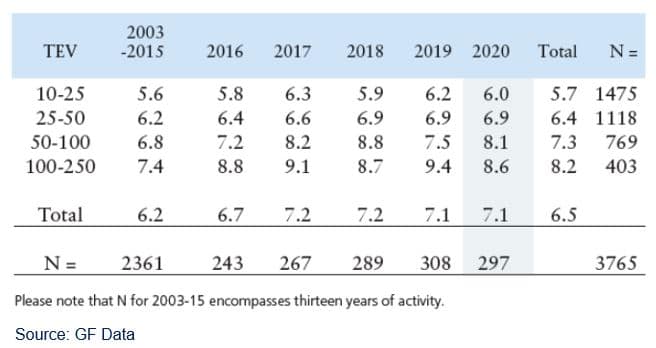
Transaction multiples in 2020 for deals with Transaction Enterprise Values (TEV) of $10 million to $250 million finished strong, with an average of 7.1x EBITDA equal to the 2019 average.
Total Enterprise Value (TEV)/EBITDA

Multiples improved in Q4 2020 after a .6x COVID-19 impact in Q3. The decrease of .8x EBITDA in the $100 million to $250 million TEV range can be partially attributed to a tightening of debt leverage in this category. Valuation multiples remained stable as buyer demand for quality deals outstripped supply. Companies that performed well through COVID were in high demand, and companies significantly impacted by COVID held off going to market.
Debt Leverage Decreases in 2020
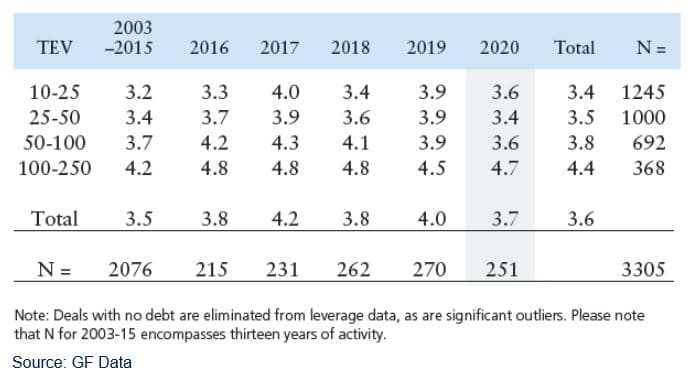
Total debt leverage decreased on average .3x EBITDA in 2020 compared with 2019. The main reason for the decrease was COVID-19-related uncertainty about the economy and business performance.
The average debt leverage in 2020 of 3.7x EBITDA comprised 3.1x senior debt and .6x subordinated debt, compared with 3.2x and .8x in 2019, respectively. The average total debt leverage in Q2 dropped to 3.3x but rebounded to 3.8x in Q4. According to a recent GF Data report, the average senior debt rate across all TEV categories was 5.2% in 2020 and 11.2% for subordinated debt.
Total Debt/EBITDA – All Industries by Deal Size

Favorable Deal Trends in 2021
Market conditions that fueled increased deal flow in Q4 2020 are expected to persist in 2021. These and other growth drivers include:
- Deals interrupted last year continue to re-emerge in 2021.
- Company financial performance has rebounded from the lows in Q2 and Q3 2020.
- Financial buyers and companies seeking growth through acquisitions have a record amount of cash that needs to be deployed.
- Opportunistic buyers are seeking out distressed companies.
- Significant private equity participation in industry consolidations.
- Low interest rates foreseen in 2021 will support a dynamic M&A market.
These salutary trends, coupled with intense buyer demand that continues to exceed the supply of attractive companies, reinforce our forecast for an active M&A market in 2021.
Contact Us
Robert Murphy
Senior Managing Director
rmurphy@pkfod.com
561.337.5324 | 201.788.6844


