While M&A deal volume is down from 2021 and 2022, it is close to pre-Covid, 2018 and 2019 levels – both years considered strong M&A markets.
By Robert Murphy, Senior Managing Director
North American M&A deal activity persisted in its deceleration trend throughout the first half of 2023, building upon the contraction observed in the second half of 2022. M&A deal volume decreased 17.5% from the second half of 2022, while year-over-year deal volume declined by 27.0% from the first half 2023 versus 2022. After 2021’s record-breaking deal volume and low-interest-rate-driven strong first half of 2022, M&A activity has declined in the last four quarters. According to PitchBook, PE deal-making has declined in four of the last six quarters and has yet to stabilize. Since peaking in Q4 2021, PE quarterly volumes are now down 24.0% by deal count.
Completed M&A Deals in North America (Q1 2019 – Q2 2023)
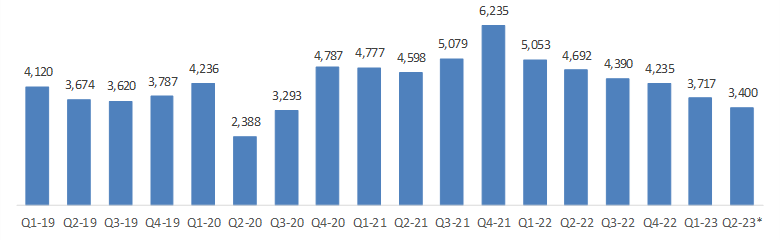
Note: Projected Q2 2023 deal count based on deals reported through July 24, 2023.
Source: PitchBook & PKF Investment Banking research.
Several key factors have contributed to the slowdown in the M&A market:
- Ongoing Interest Rate Increases. The Federal Reserve has implemented its 11th benchmark interest-rate hike since March 2022, pushing it to its highest level in 22 years. Consequently, the financial market is challenged with a persistently high interest rate environment, making borrowing cost prohibitively expensive for certain deals that would otherwise proceed, especially in the higher end of the market.
- Persistent Inflation. Although inflation has been mitigated to 3% in June 2023, a significant improvement from its highest 9.1% in June 2022, the consistent presence of high inflation rates over the past 12 months have negatively impacted the M&A market.
- Several Bank Failures. The turmoil in the regional banking sector, with the collapse of Silicon Valley Bank, Signature Bank and First Republic and the collapse of Credit Suisse, has intensified the banks’ more risk-averse stance in underwriting new deals.
- Recession Threat. Economic uncertainty with regard to a near-term recession has contributed to a more risk-averse position with buyers and lenders, resulting in decreased deal activity in certain sectors, especially more cyclical sectors.
- Seller-Buyer Valuation Gap. Significant tightening in the leverage buyout market starting in the middle of 2022, combined with economic uncertainty, has caused a dislocation in buyer/seller value expectations resulting in a material decrease in PE exits. The private credit funds have helped to fill some of the void.
The lower middle market (LMM) deal sizes between $10 and $250 million is less impacted by interest rates and tightening debt markets, as leverage levels are more moderate with these deal sizes and many of the deals in the LMM are add-on acquisitions. LMM activity has benefited from an increased focus on add-ons by PE, increasing to 78% of all buyouts by PE firms in the first six months of 2023, according to PitchBook.
Higher Interest Rates Lead to Increased Borrowing Cost, Lower Debt Leverage, and Increased Equity Investment
Borrowing costs have increased due to elevated Fed interest rates. According to GF Data, average senior debt reached to 8.1% in Q1 2023 compared to an average of 6.7% in Q4 2022, while all-in pricing on subordinated debt surged to an average of 16.8% compared to an average of 14.5% for all of 2022.
The higher borrowing cost has caused leverage buyout firms to adjust their valuation models to account for the higher interest expense, resulting in deals financially less attractive or feasible. More expensive borrowing costs have also led to higher capital costs for companies, potentially discouraging overall corporate investments as corporations intend to cut back on spending, slow down expansion plans or avoid riskier projects.
Federal Fund Effective Rate (January 2006 – June 2023)
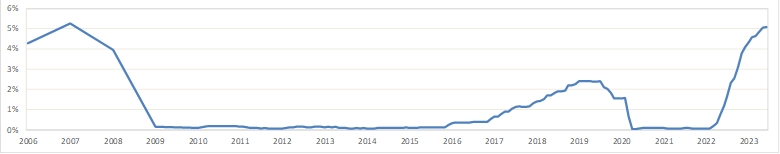
Source: Board of Governors of the Federal Reserve System (US).
According to GF Data, although average senior and subordinated debt contribution in Q1 2023 remained relatively stable compared to Q4 2022, platform deals experienced a decline in multiples of coverage for both total debt and senior debt on an annualized basis. Total debt on platform stood at an average of 3.4x EBITDA compared to 3.6x for all of 2022, while average senior debt declined from 2.8x in the previous year to 2.5x.
Total Debt/EBITDA – Platform Buyouts Only | ||||||||
TEV | 2003 – 2018 | 2019 | 2020 | 2021 | 2022 | YTD 2023 | Total | N = |
10-25 | 3.0 | 2.8 | 2.9 | 3.2 | 3.2 | 3.3 | 3.1 | 794 |
25-50 | 3.0 | 3.6 | 3.1 | 3.3 | 3.2 | 3.1 | 3.3 | 777 |
50-100 | 3.8 | 3.7 | 3.5 | 3.8 | 3.6 | 3.0 | 3.7 | 585 |
100-250 | 4.8 | 4.5 | 4.6 | 4.3 | 4.3 | 3.8 | 4.4 | 352 |
250-500 | 5.8 | 5.1 | 3.9 | 5.2 | 5.5 | 4.6 | 5.0 | 50 |
Total | 3.5 | 3.6 | 3.4 | 3.7 | 3.6 | 3.4 | 3.5 |
|
N = | 1,664 | 205 | 182 | 297 | 175 | 45 |
| 2,558 |
Senior Debt/EBITDA – Platform Buyouts Only | ||||||||
TEV | 2003 – 2018 | 2019 | 2020 | 2021 | 2022 | YTD 2023 | Total | N = |
10-25 | 2.0 | 2.0 | 2.1 | 2.1 | 1.9 | 2.1 | 2.0 | 612 |
25-50 | 2.4 | 2.5 | 2.4 | 2.3 | 2.4 | 2.1 | 2.4 | 680 |
50-100 | 3.2 | 3.0 | 2.8 | 3.1 | 3.0 | 2.3 | 3.0 | 517 |
100-250 | 3.8 | 3.9 | 3.8 | 3.7 | 3.4 | 3.1 | 3.5 | 292 |
250-500 | NA | 5.1 | 3.9 | 5.1 | 4.5 | 4.1 | 4.5 | 38 |
Total | 2.7 | 2.7 | 2.7 | 2.9 | 2.8 | 2.05 | 2.6 |
|
N = | 1,432 | 166 | 141 | 230 | 132 | 38 |
| 2,139 |
Note: Deals were not identified as platforms or add-ons until 2006 – thus the prior period count here is incomplete in relation to the total universe. Please note that N for 2003-18 encompasses 16 years of activity.
Source: GF DATA an ACG Company.
In response to the tightening lending market, private equity firms have increased their equity investments to compensate for the reduced availability of senior debt. According to GF Data, average equity contribution on platform deals rose to 59.7%, while average senior debt contribution decreased to 29.6% (compared to 56% and 32.4% respectively last year). Meantime, the average equity contribution on larger platform deals valued between $100 million and $250 million reached 63% year to date, making the highest quarterly average tracked by GF Data, compared to an average of 55.1% for all of 2022.
Downward Pressure on Valuation Multiples but Very Sector- and Company-Specific
Economic uncertainty, higher borrowing costs and a tighter lending environment has pushed down valuation multiples. The chart below shows a 9.1% decrease in revenue valuation multiple for PE deals in the first half of 2023 compared with 2022.
Meridian PE EV/Revenue Multiples
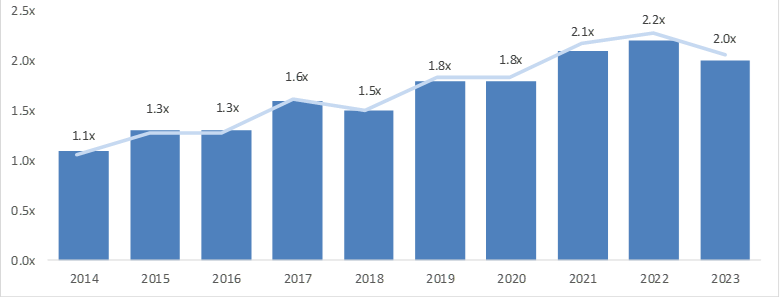
Note: Geography: North America and Europe as of June 30, 2023|
Source: PitchBook
However, the change in valuation multiples in this market varies significantly based on size, sector, and individual company performance. A flight to quality is evident, with companies demonstrating strong financial performance in sectors that can thrive during a recession, experiencing high demand and commanding premium valuation multiples. On the other hand, industries that have already seen a contraction in demand for their products and services (i.e., many sectors in the retail space) and more cyclical industries have encountered a more pronounced valuation decrease.
The LMM, especially the lower end, has shown more resilience in terms of valuation multiples. PE firms remain highly active in pursuing add-on acquisitions to grow their platforms. Additionally, lower debt leverage is utilized in these deal sizes, and there is less of a valuation disconnect between buyers and sellers as deals in the LMM tend to transact within a tighter multiple range. These factors contribute to the LMM’s valuation multiple stability.
Outlook – Increasing M&A Activity the Next 12 Months
Our outlook on M&A activity in the second half of 2023 is cautiously optimistic. We expect deal volume to be consistent with the first half with a small increase possible. We expect quality companies with strong financial performance will continue to garner significant interest with strong valuation multiples. We expect buyers and lenders to maintain a more risk-averse approach to cyclical industry sectors.
Recent positive economic indicators have bolstered deal-making sentiment. The rising cost of U.S. goods and services slowed to a two-year low in June, signaling an easing of inflation as the economy responds to the Fed’s rapid interest rate increases. The economy has remained resilient, with the market outlook expecting the end to interest rate hikes in 2023, interest rate reductions in 2024 and a soft landing.
The rebound in public markets during the first half of 2023 has been significant, with the S&P 500 recording a 17.6% one-year gain as of June 30, contrasting sharply with the 18.1% one-year negative return just six months prior. This improvement in public equity markets has contributed to a more positive tone in the M&A market and signals growing confidence in the economic outlook. Big banks have gradually re-entered the leveraged buyout market and credit funds have remained active. Furthermore, the significant amount of capital waiting to be deployed by PE’s and strong corporate balance sheets will continue to support M&A activity.
Contact Us
Robert Murphy
Senior Managing Director
PKF Investment Banking
rmurphy@pkfib.com
561.337.5324 | 201.788.6844